

Consumer Labels & Shopping Tips
Infographic: Facts on American Lamb (pdf)
Learn all about great American Lamb! From USDA grades to cuts to proper cooking temperatures, it’s all right here!
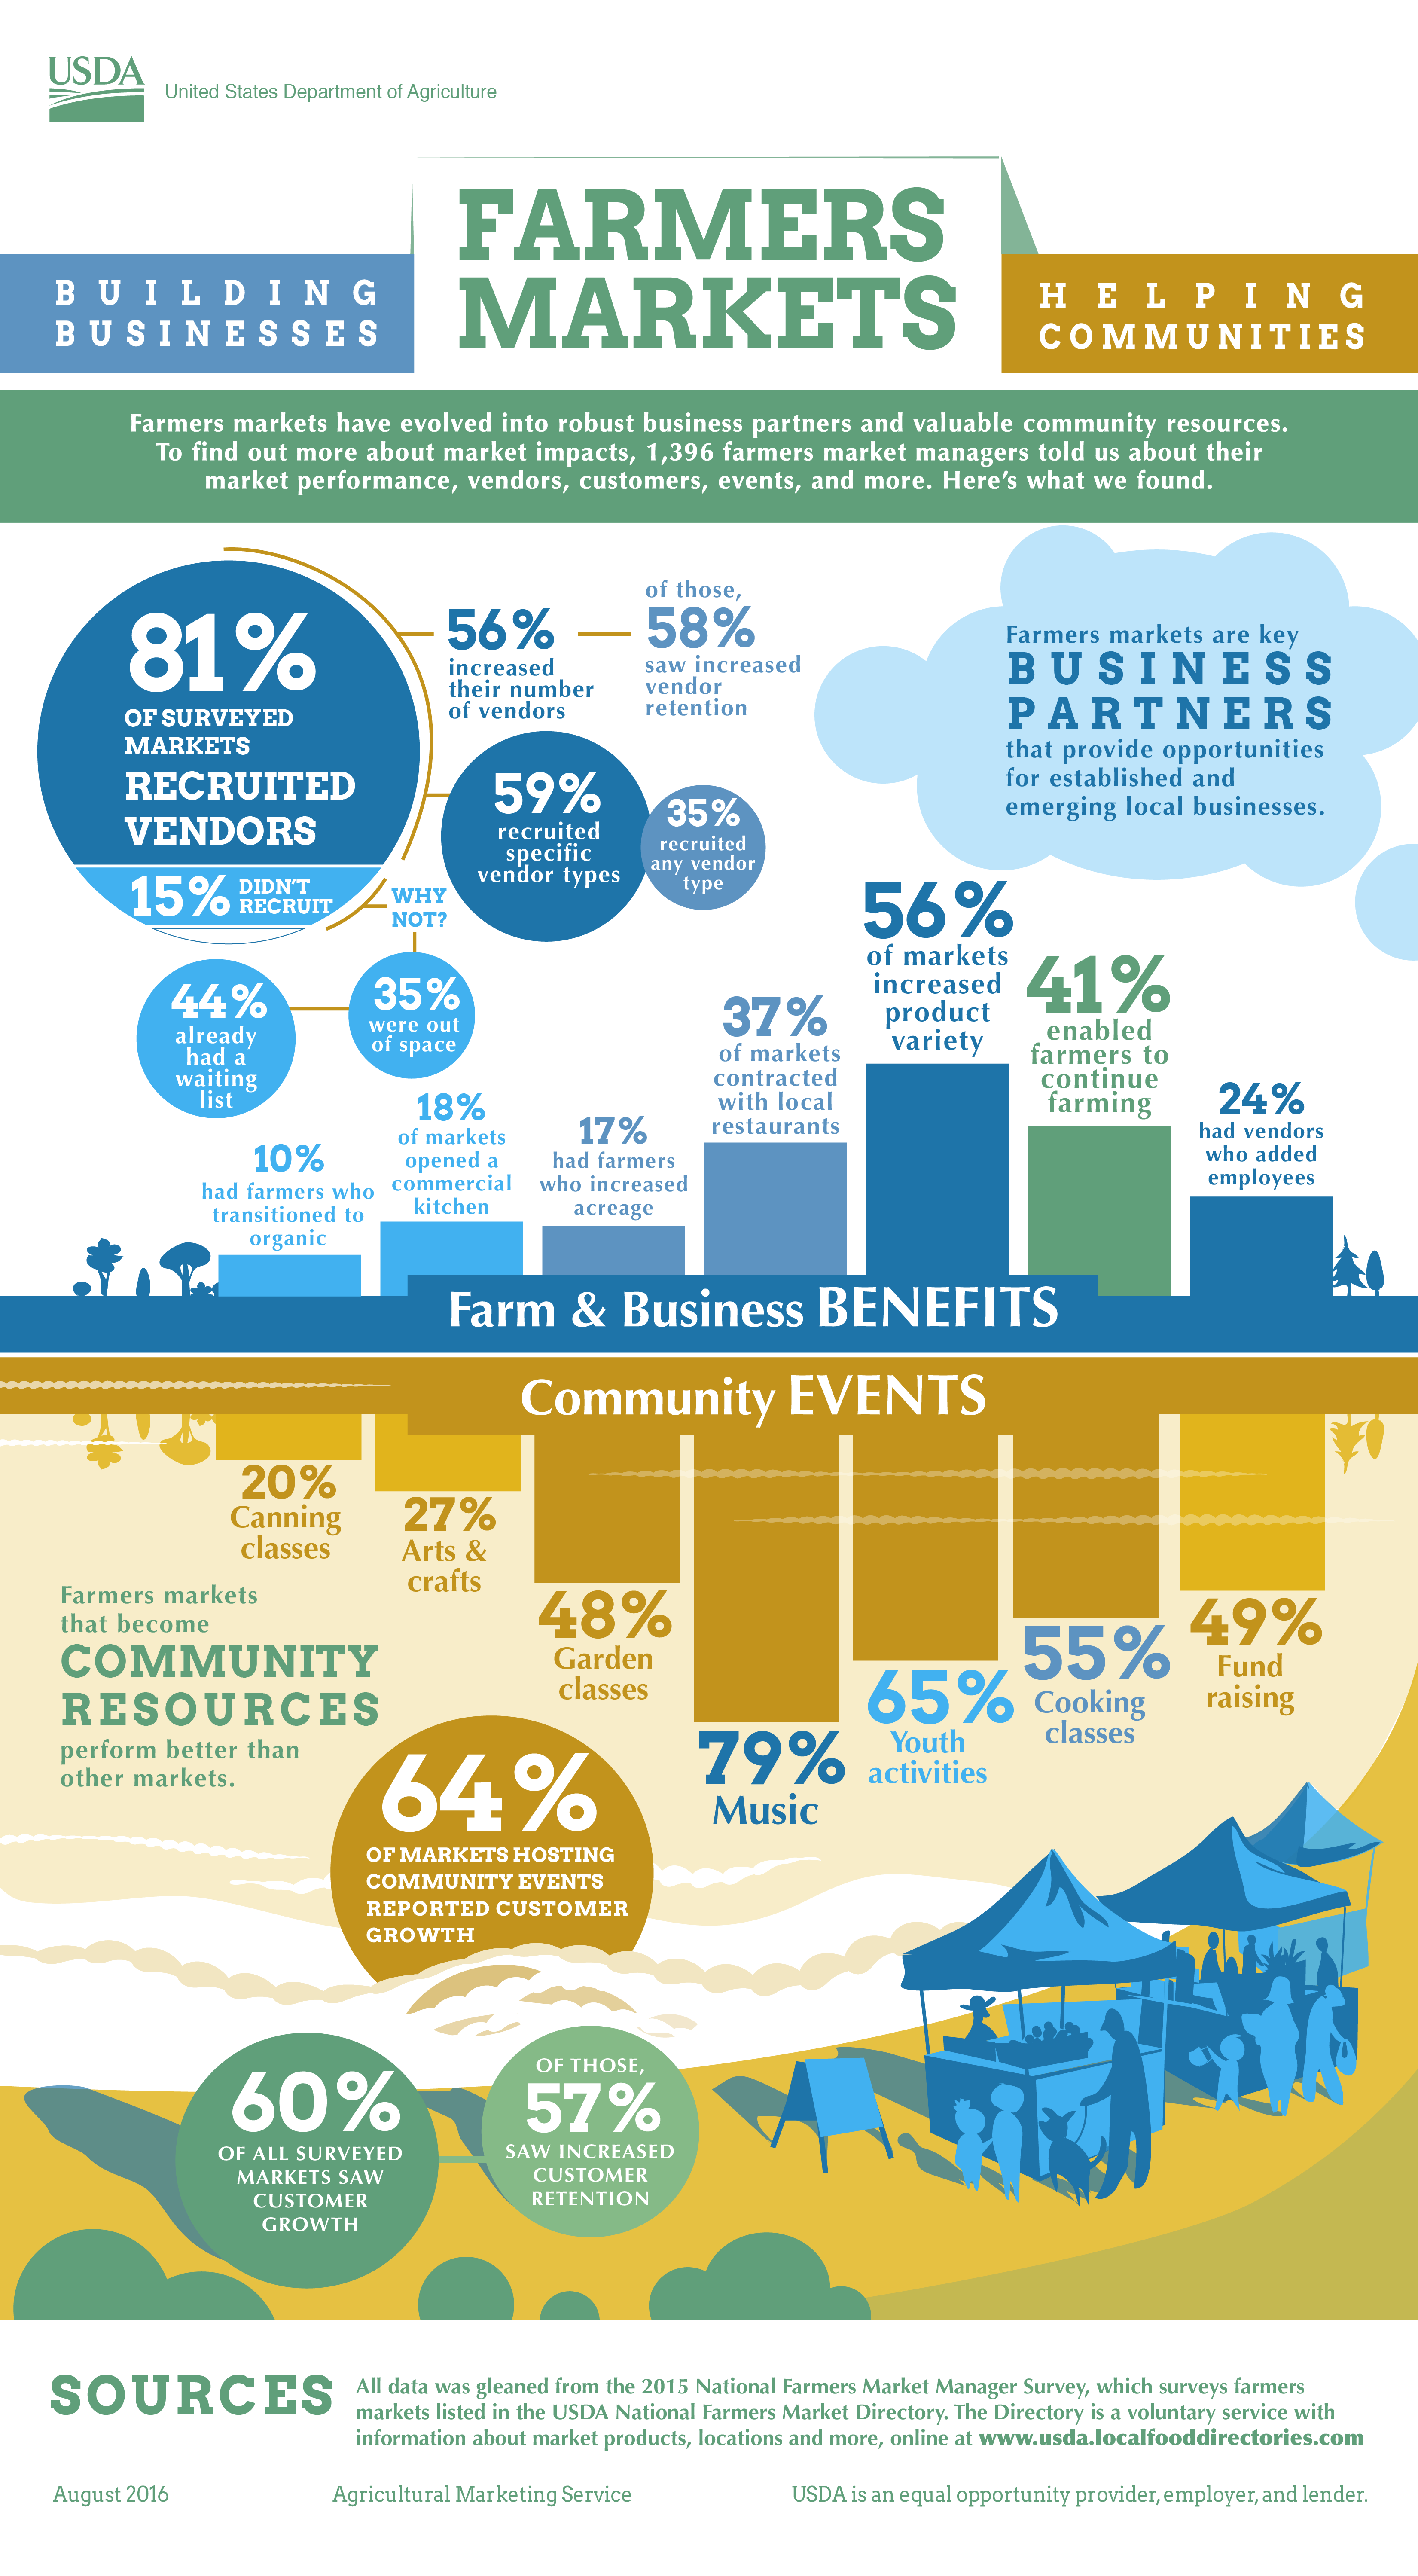
Infographic: Farmers Markets — Building Businesses, Helping Communities (png)
Learn about market impacts through information gathered from over a thousand market managers.
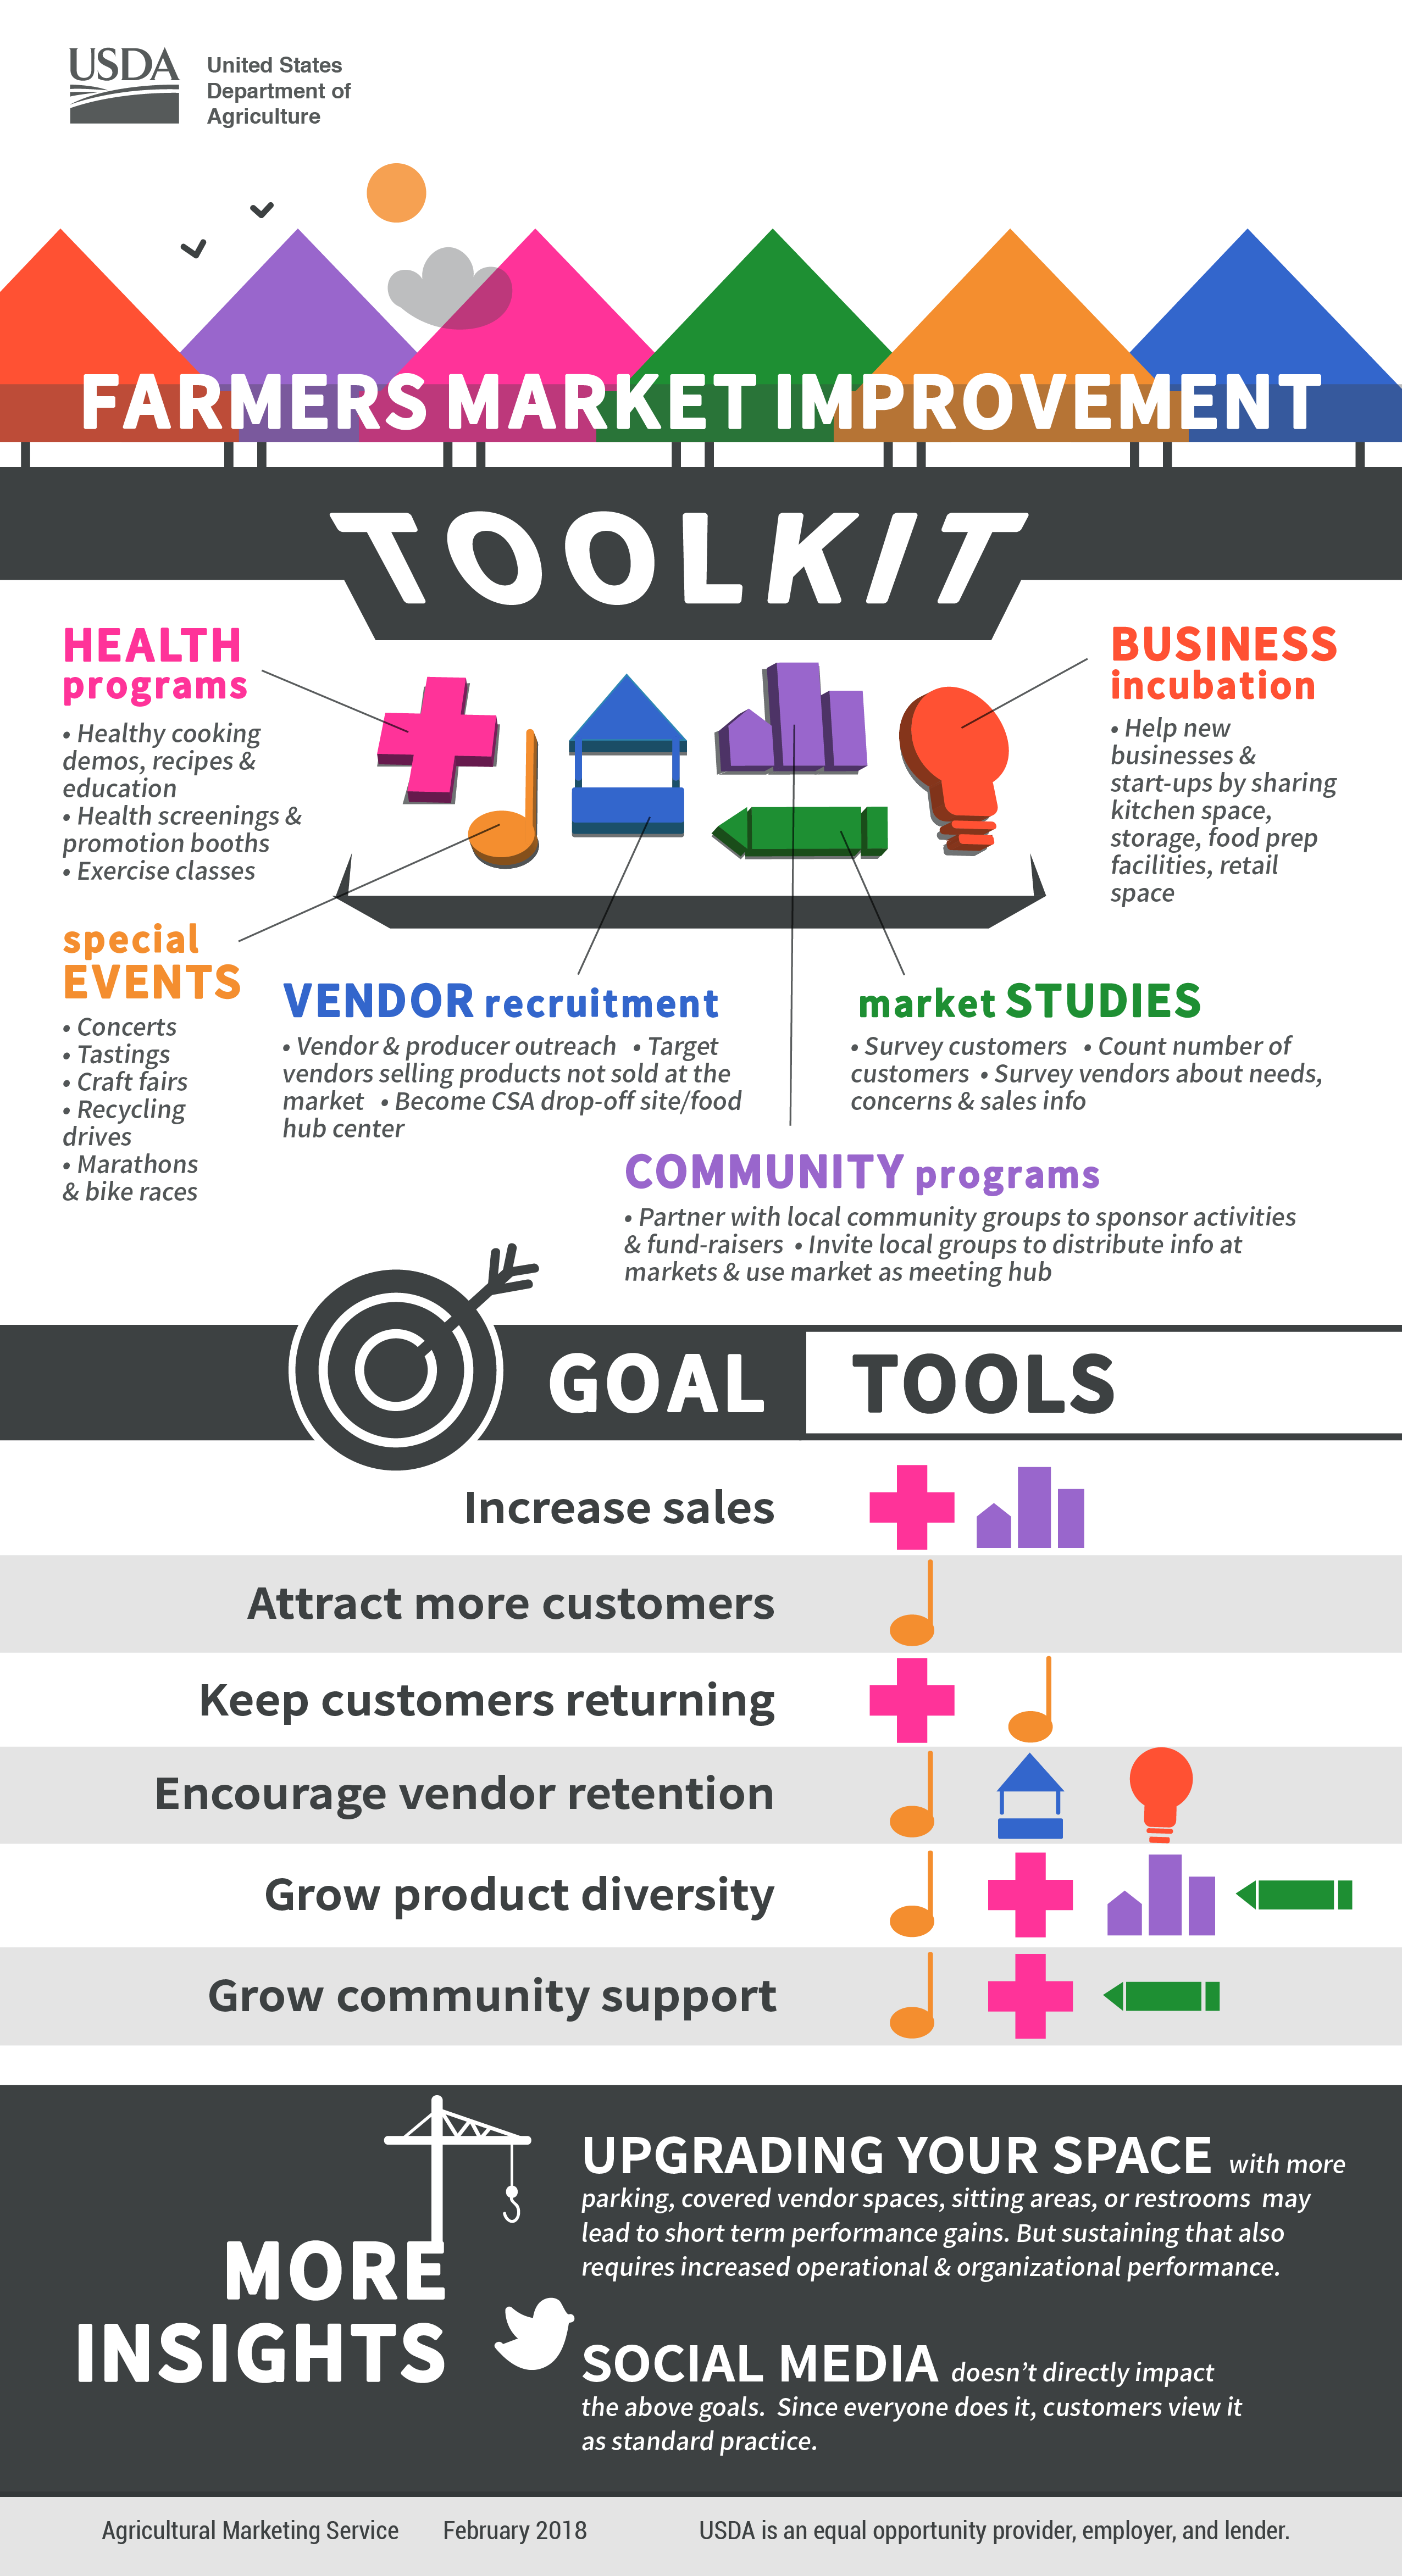
Infographic: Farmers Market Improvement Toolkit (png)
Are you a farmers market manager? Learn what works to increase sales, attract customers, increase vendor retention, and more.
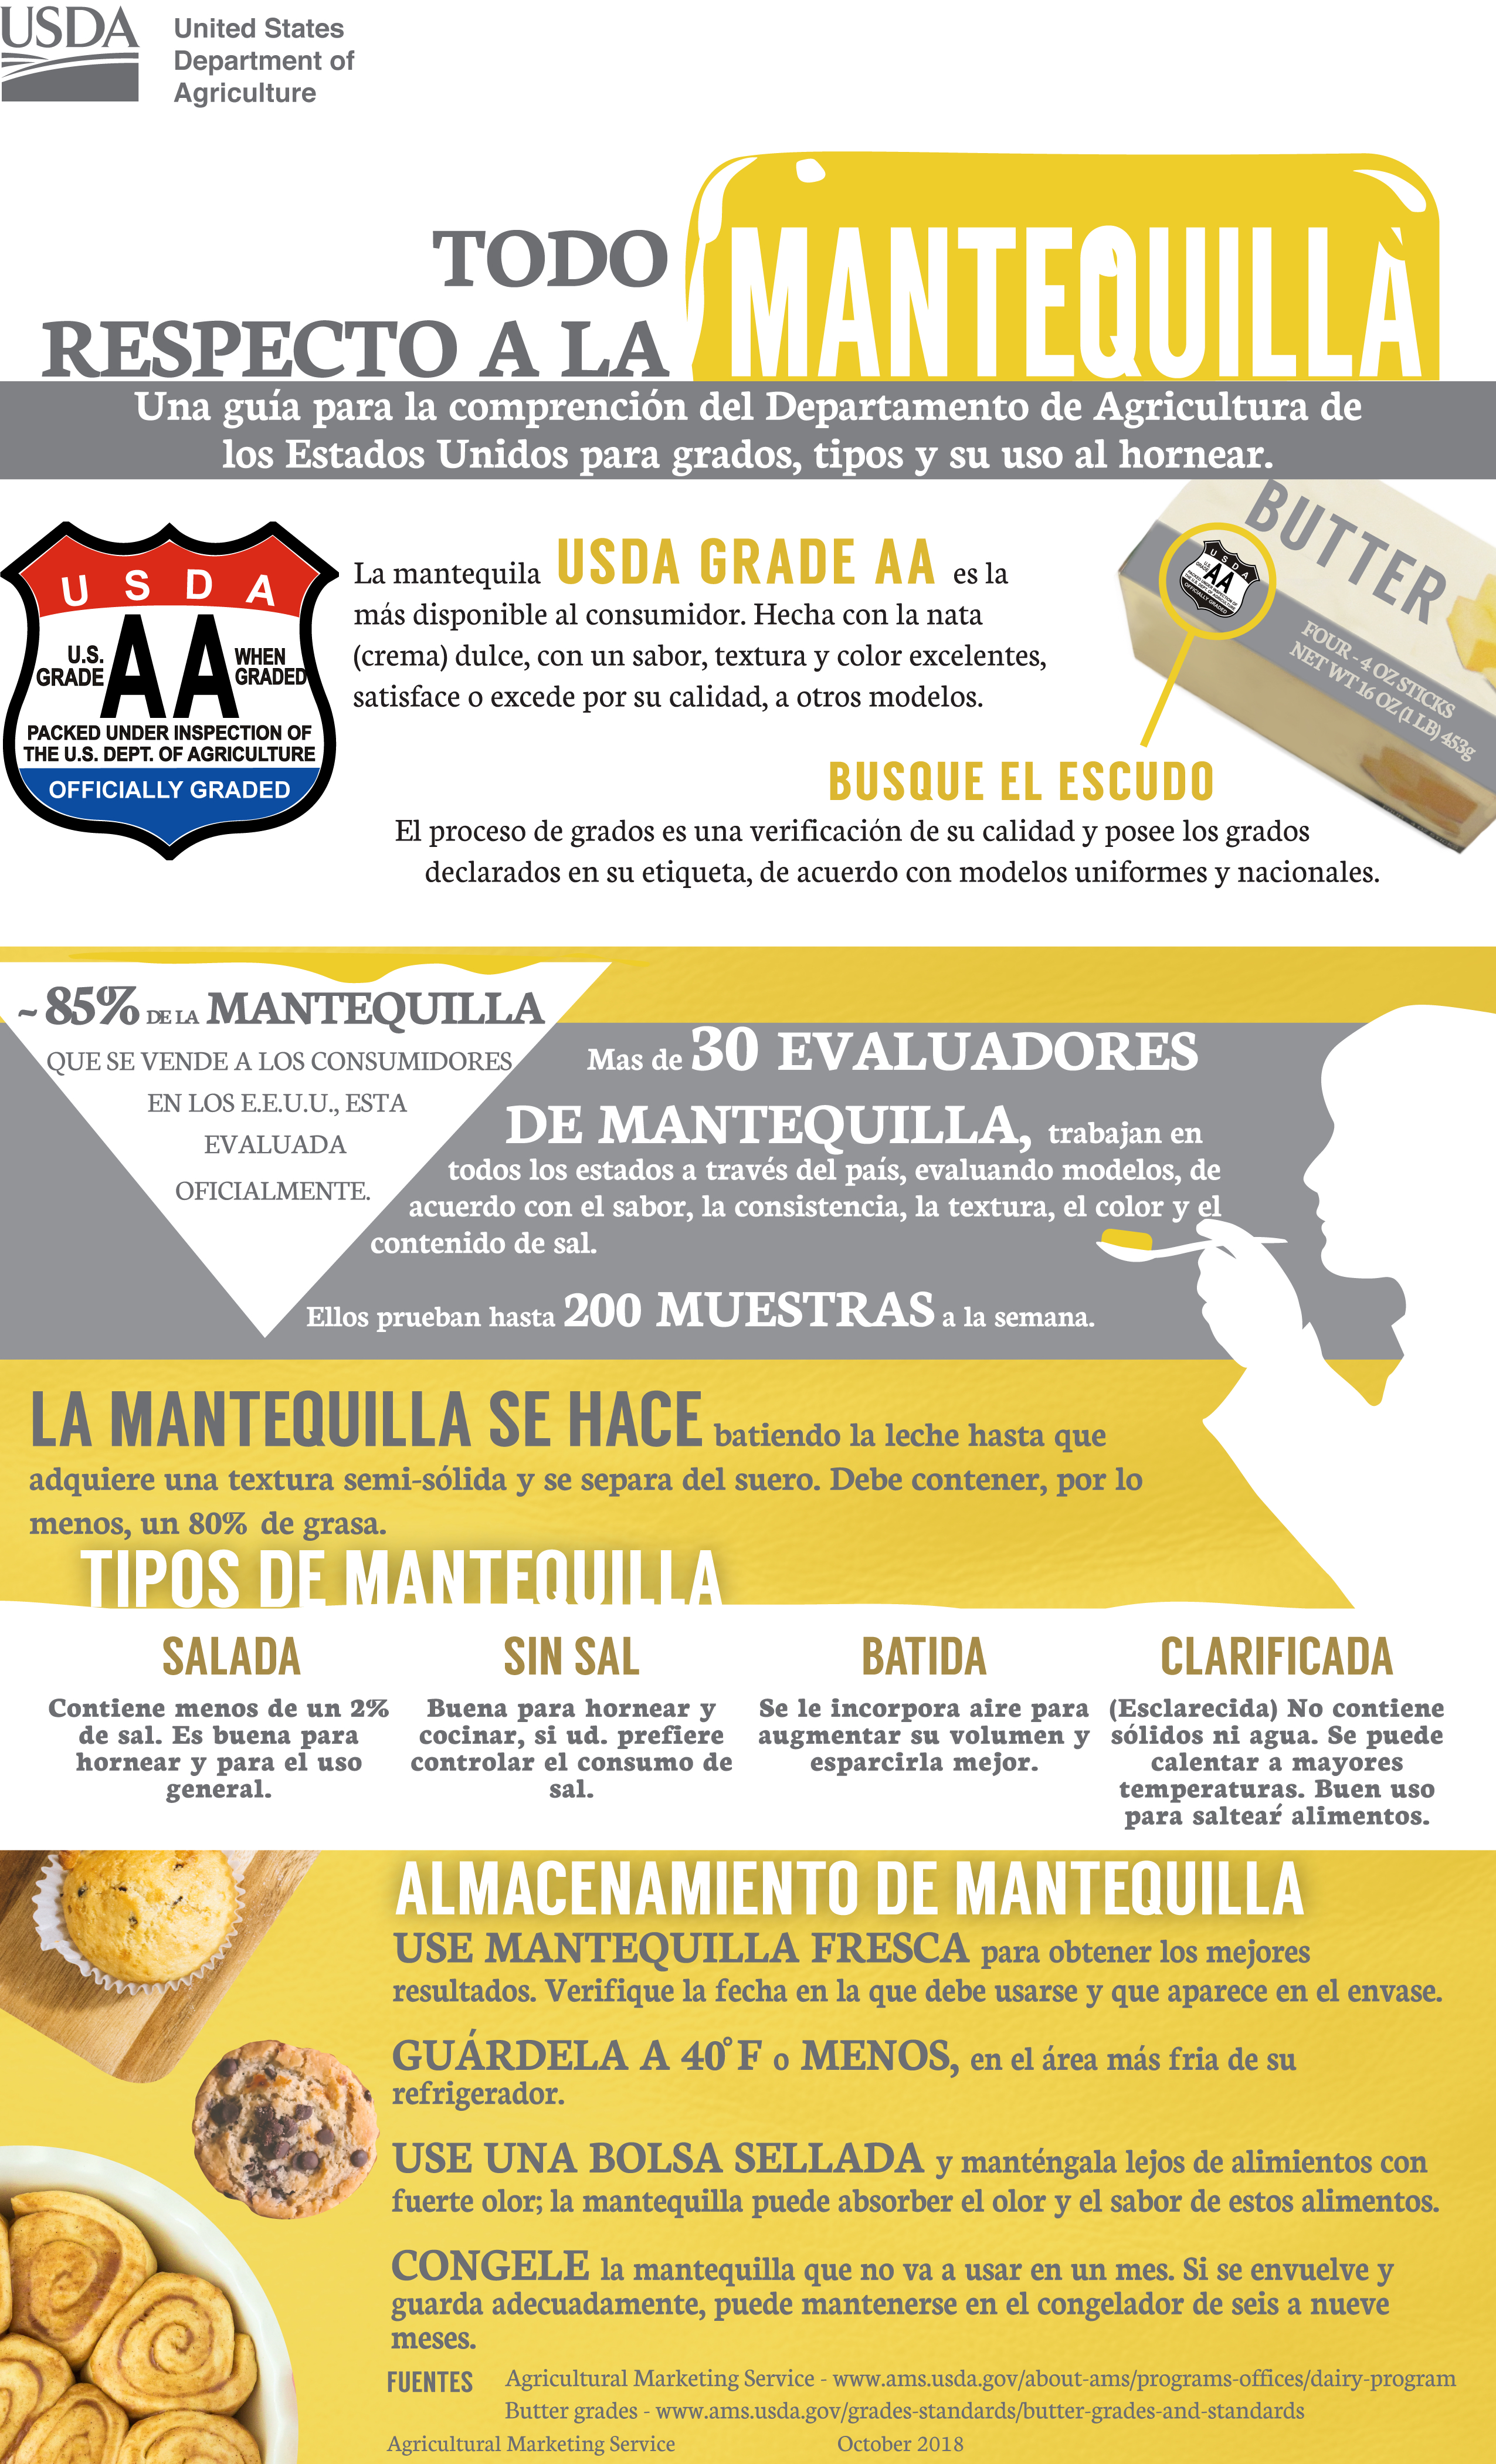
Infographic: All About Butter
Learn about butter grades, types of butter and which butter to use during cooking or baking.
Spanish Language: Todo Respecto a la Mantequilla (jpg)
Infographic: USDA Process Verified Program: Transparency from Farm to Market
Get a better understanding of the USDA Process Verified Program and how USDA supports #TruthinAg with third-party objective auditing of the food you eat.
Infographic: USDA Food Purchasing
Learn how our food commodity purchasing acts as the bridge between farmers and communities.
Infographic: Understanding USDA Beef Grades
Which U.S. Department of Agriculture (USDA) beef grades work best for grilling, roasting, or marinating? Learn everything you need to know about beef marbling and grades to help you select the perfect beef for your next culinary masterpiece.
Infographic: Poultry 101
Do you know which cut of chicken stays moist during grilling, or what temperature to cook it to? This infographic will help you understand USDA poultry grades, terms and cooking recommendations.
Infographic: Get the Scoop on Eggs
This breakdown of USDA egg grades, labels and sizes will give you practical tips about buying eggs.
Pocket Card: Egg Pocket Calendar
This handy guide will help you determine just how fresh your eggs are.
Infographic: USDA Certified Egg Facts
Learn about common labeling terms, definitions, and other eggcellent facts.
Food System Transformation
Local & Regional Food Systems
Infographic: Food Hubs: Building Businesses, Sustaining Communities
Did you know food hubs have 19 paid employees on average? Learn how food hubs are building businesses and sustaining communities in this infographic.
Infographic: The Food Chain Reaction from a Farmers Market
Connecting rural to urban, farmer to consumer, and fresh ingredients to our diets, farmers markets are becoming economic and community centerpieces in cities and towns across the U.S. See how the chain reaction works in this infographic.
Supply Chain Resilience
Infographic: Building a Resilient Food System from Farm to Fork (pdf)
AMS is leading USDA’s response to the President’s Executive Orders to strengthen America’s supply chains and ensure farmers have greater opportunities to access markets and receive a fair return for their products. Since 2021, we’ve implemented new programs to build resiliency in the food system moving forward.
Agricultural & Market Data
Infographic: USDA Market News
Through USDA Market News, Agricultural Marketing Service (AMS) provides timely, reliable, unbiased data that serves as the information lifeline for America’s agricultural economy. Learn how it all began a century ago.
Infographic: Ag Conservation: Research and Promotion Programs at Work
This infographic explores water conservation efforts across American commodity production.
Infographic: How Stores Buy and Sell for Holidays
This illustrated guide to spot markets offers insight into how store holiday ads can affect the sale of featured items.
Holiday Stats & Trivia
Infographic: The Superbowl and Chicken
Want to know how much chicken was eaten during Superbowl 52? Check out this infographic comparing facts between Superbowl 1 and Superbowl 52.
Infographic: Chicken Wings & Super Bowl XLVI
Want to know how many pounds of chicken wings were eaten on Super Bowl XLVI? Check out this infographic highlighting facts about wings and the Super Bowl.
Infographic: Valentine’s Day Stats and Figures
What gift do most women prefer on February 14th? Find out with this infographic on Valentine’s Day stats and figures.
Infographic: St. Patrick's Day: An Exploration of Corned Beef & Cabbage
This infographic highlights the history, anatomy and market of a Saint Patrick’s Day favorite; learn how corned beef and cabbage became an Irish tradition.
Infographic: Spring Foods
Do you know how old the custom of decorating Easter eggs is? Or what the unofficial Easter veggie is? This infographic delves into traditional Spring foods with fun facts and food safety tips.
Infographic: The International Flavors of Cinco de Mayo
Where did avocados and chili peppers originate? This infographic traces the heritage of Cinco de Mayo staples.
Infographic: Harvest of the Fall: Halloween Favorites
How many pounds of US-produced corn ended up as candy corn in 2012? This infographic uncovers fun facts and figures about Fall harvests and Halloween trends.
Infographic: Thanksgiving Brought to You by the American Farmer
Check out this infographic to explore the traditional Thanksgiving meal, and to see how Americans around the country celebrate with unique regional dishes. Pumpkin Ice Cream Pie, anyone?